A Work Breakdown
Structure (WBS) is a super tool as it presents a visualisation of the total scope
of a project. It enables management to determine, prioritise important tasks, estimate
efforts in order for the team to accomplish project goals and deliver the
desired outcomes. According to The Project Management Body of Knowledge
(PMBOK), a WBS ‘’is a hierarchical and
incremental decomposition of the project into phases, deliverables and work
packages’’ (Project Management Institute, 2018). In a WBS, the deliverable is
the end goal and it can be a thing, a service, or an activity, and that depend
on our project.
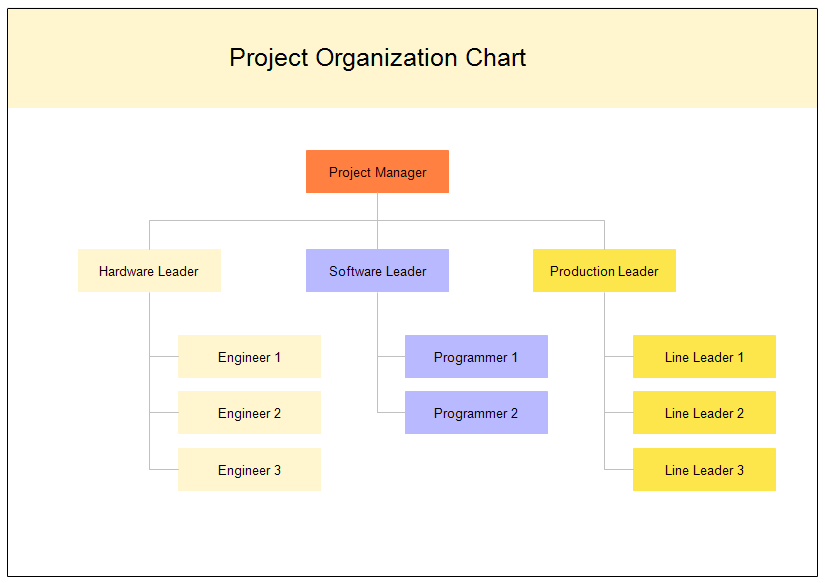
Elements

Figure 1
Simple WBS Chart
There
are many methods to partition or break down project work, the most popular is a
form of visual demonstration of the project’s activities, phases, and
deliverables in one single chart. The team determine project milestones, deliverables
and break them further down into smaller components, called activities, required
to complete the deliverable or milestone.
Typically,
the WBS chart looks like a tree-structured diagram, but it can also be in the form
of hierarchical tables or numbered lists. Regardless of the format, a WBS normally
consist of Terminal elements (aka work packages), WBS coding and dictionary. Work
packages are the lowest or smallest units of work. WBS coding includes outline
numbering of WBS elements in decimal sequences to represent the sequential
order of each level and activity. Finally, to complete the WBS, a related
dictionary may be created. This will contain detailed information about each
element of the project. The dictionary includes definitions of each work
package, effort level, duration of tasks, and resources. A WBS dictionary is generally presented in a
table or spreadsheet format.
Purpose
The
primary goal of a WBS is to make a large project more manageable. It aids to transform
project activities into less complicated tasks, so it is easier for the team to
understand the scope of the project and work related. By breaking down activities
into smaller chunks it means work can be done simultaneously by different team
members, leading to better team productivity and overall easier project
management.
Work Breakdown Structure analysis
A good way to
identify the potential risks is to analyse our WBS. The team draws a diagram
and questions each and every element, which eventually will give a valid list
of potential risks for the project. As they are connected to the appropriate
work packages this means the team will be in a better position to handle the
risks.
References:
Practice Standard for Work Breakdown Structures (Second
Edition), published by the Project
Management Institute, ISBN 1933890134, page 8
Images